Bias correction of data by geo locations (Module 1)
Data description
The data used in the module consist of hourly measurements of PM10 air pollution from citizen stations, which also includes a unique geohash indicating the citizen station location, the PM10 and PM2.5 air pollution measurement, temperature, humidity and pressure measurements as well as the associated time (day and hour) at which they were taken. At the same time, we use the available dataset on PM10 concentration measured at the five official stations so as to construct benchmark levels that are important part in the process of data cleaning.
Priliminary data cleaning
Before we apply the procedure as described in the text below, we conduct preliminary data cleaning. First of all, we cap levels of PM10 concentration by citizens’ stations taking into account official hourly measurements. The figure below illustrates the percentage of observations that should be capped for application of different threshold levels. We apply a threshold of 125%, i.e. all observations with values above 125% of the maximum official measurement for the particular hour are capped to this level. This choice suggests that approximately 10% of all observations are capped.
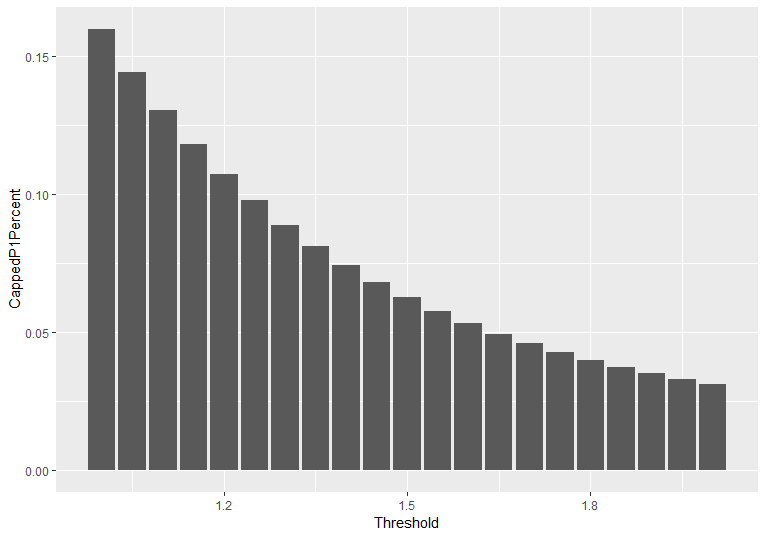
Figure: Percentage of observations that should be capped at different threshold levels.
Secondly, we remove stations with history of less than a preset threshold value. The figure below presents the percentage of stations as a function of available observation days. We select a threshold of 90 days, i.e. we analyze further only citizens’ stations with history of at least 3 months. As might be seen from the figure less than 25% of all available stations have observation history of less than 3 months. We remove these stations from our sample.
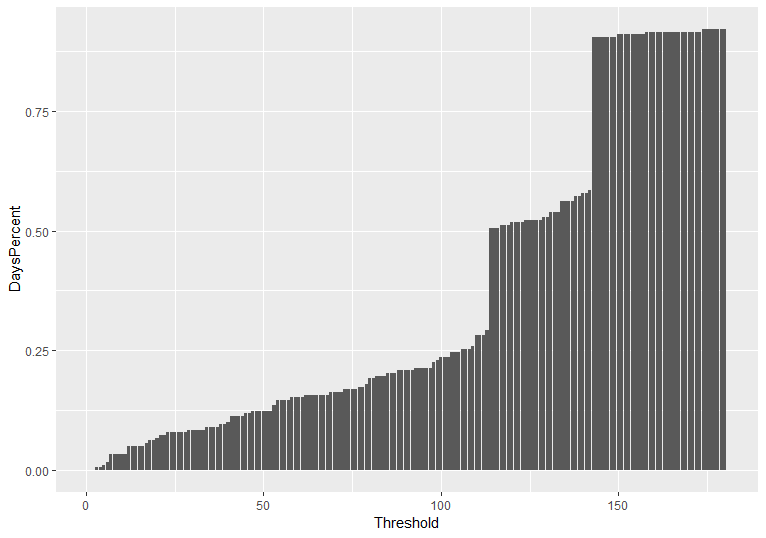
Figure: Percentage of stations as a function of available observation days.
Procedure overview
The following procedure was used in order to identify citizen stations, where the data quality might be questionable and remove them from the dataset used in module 3:
- Step 1. Calculate the distances between all the station pairs.
- Step 2. Create а group for each station, which include the station (will be referred to as main station) and all the station within a certain distance of it (will be referred as group station).
- Step 3. Calculate a dissimilarity measurement for each pair of main station- group station of in the group.
- Step 4. Based on this dissimilarity measurement, identify the station which has the most main station-group station pairs with a big dissimilarity measurement. In case of a tie, pick one of the tied at random.
- Step 5. Remove the station from the dataset and repeat from step 2.
- Step 6. Stop when some condition is met.
Definitions
As can be seen from the procedure described above, the following things must be defined:
\1. What distance and what threshold to be used to create the groups?
The Cartesian minimum distance was calculated using the longitude and latitude coordinates of the citizen stations and a threshold of 0.01 was used.
\2. How to define the dissimilarity measure?
The dissimilarity measure was defined the following way:
a. The absolute difference in the PM10 for each hourly measurement, for each main station – group station was calculated.
b. The relative difference in the PM10 for each hourly measurement, for each main station – group station was calculated, as the absolute difference divided by the bigger of the two measurements.
c. The number of observations in common between the main station - group station pair was counted
If (a) is more than 10, then the single instance of measurement is considered dissimilar. However (b) must be at least 168(the number of hours in a week), in order to have a valid dissimilarity measurement. If this is not the case, it is considered that the number of common observations is not enough to draw any conclusions and no score is calculated. The effect is the same, as if the group station is not part of the group.
Then based on a threshold of 10 station pairs, which are considered too different are identified, meaning that at least 5% of the common observation between the pair are too different.
\3. How many times to repeat the process/When to stop the removal of stations?
The process was repeated until in each group there is no more than one main station-group station with a dissimilarity score of over 10.
After applying the aforementioned procedure, the number of stations in the dataset was reduced from 148 to 127.
Code
Download the R code here… Download the data here…
Set up environment
rm(list=ls())
gc()
Set the path of the folder with data
setwd("/data")
Import data on EEU measurements for 2017 and 2018
eeu=list.files(path="/data",pattern="BG*")
ddeu=lapply(eeu,read.csv,na.string=c("","NA"," "), stringsAsFactors = F, fileEncoding="UTF-16LE")
Name data sets by stations
for (i in 1:length(eeu)){
  eeu[i]=gsub("BG_5_","st", eeu[i])
  eeu[i]=gsub("_timeseries.csv","", eeu[i])
  names(ddeu)[i]=eeu[i]
}
rm(eeu,i)
Select only the observations with averaging time == “hour”
for (i in 1:length(ddeu)){
  ddeu[[i]]=ddeu[[i]][ddeu[[i]]$AveragingTime=="hour",]
}

count = 0
i = 1
while(0 == 0){
  if (count == 1){
    i = i - 1
  }
  if(i > length(ddeu)){
    break
  }
  count = 0
  if(dim(ddeu[[i]])[1] == 0){
    ddeu[[i]] = NULL
    count = 1
  }
  i = i + 1
}
rm(count,i)
Check variables’ class of ddeu
sapply(lapply(ddeu,"[", ,"DatetimeEnd"),class)
sapply(lapply(ddeu,"[", ,"Concentration"),class)
Fix the class of the time variable
if(!require(lubridate)){
  install.packages("lubridate")
  library(lubridate)
}
for (i in 1:length(ddeu)){
  ddeu[[i]]=ddeu[[i]][,c("DatetimeEnd","Concentration")]
  ddeu[[i]]$DatetimeEnd=ymd_hms(ddeu[[i]]$DatetimeEnd, tz="Europe/Athens")
  colnames(ddeu[[i]])=c("time","P1eu")
}

sapply(lapply(ddeu,"[", ,"time"),class)
Make a time vecor with hourly sampling rate
teu=list()
for (i in 1:length(ddeu)){
  teu[[i]]=as.data.frame(seq.POSIXt(from=min(ddeu[[i]]$time),to=max(ddeu[[i]]$time), by="hour"))
  colnames(teu[[i]])[1]="time"
}
Make a list of time series on official P10 concentration for every station
if(!require(dplyr)){
  install.packages("dplyr")
  library(dplyr)
}

if(!require(devtools)){
  install.packages("devtools")
  library(devtools)
}

for (i in 1:length(ddeu)){
  teu[[i]]=left_join(teu[[i]],ddeu[[i]],by="time")
}
names(teu)=names(ddeu)
Bind datasets 2017 and 2018 for each of the official points
teu$st9421=bind_rows(teu$st9421_2017,teu$st9421_2018)
teu$st9572=bind_rows(teu$st9572_2017,teu$st9572_2018)
teu$st9616=bind_rows(teu$st9616_2017,teu$st9616_2018)
teu$st9642=bind_rows(teu$st9642_2017,teu$st9642_2018)
teu$st60881=teu$st60881_2018

teu=teu[c("st9421", "st9572","st9616","st9642","st60881")]
for (i in 1:length(teu)){
  colnames(teu[[i]])[2]="P1"}
rm(i,ddeu)
Check for duplicates
sapply(teu,dim)[1,]
sum(duplicated(teu[[1]]$time)) #0
sum(duplicated(teu[[2]]$time)) #0
sum(duplicated(teu[[3]]$time)) #0
sum(duplicated(teu[[4]]$time)) #0
sum(duplicated(teu[[5]]$time)) #0
Interpolate missing values for P1eu
if(!require(imputeTS)){
  install.packages("imputeTS")
  library(imputeTS)
}
Check the number of missing obs
sapply(sapply(teu,is.na),sum)
sapply(sapply(teu,is.na),sum)/sapply(teu,dim)[1,]
Apply linear interpolation
for (i in 1:length(teu)){
  teu[[i]][,2]=na.interpolation(teu[[i]][,2], option="linear")
}
rm(i)
Aggregate official measuremnets on daily basis
Extract date from the time variable
for (i in 1:length(teu)){
  teu[[i]]$date=date(teu[[i]]$time)
}
rm(i)
Thresholds
thresholdForRemovalMissingP1 <- 0.2
Removes all observations where the P1 is equal to 0 for more than the threshold % of observations
thresholdP1ForDeviationFromOfficial <- 1.25
Caps the P1 of the citizen data at thresholdP1ForDeviationFromOfficial% of official P1 maximum
thresholdForMinimumObservationDays <- 90
Removes all observations with less than thresholdForMinimumObservationDays days of observation history
thresholdForCloseness <- 0.01
Determines which stations are considered close enough to comapre the P1 measurments
thresholdForCommonObservations <- 168
Number of common observations to considered a difference in measurments in P1
thresholdForAbsoluteDifference <- 10
Threshold above which citizen measurments are considered too different
thresholdForDifferentStations <- 1
Threshold showing how many close stations can have different measurments before exclusion
Step 1 - Load libraries and packages
if(!require(dplyr)){
  install.packages("dplyr")
  library(dplyr)
}

if(!require(lubridate)){
  install.packages("lubridate")
  library(lubridate)
}

if(!require(geohash)){
  devtools::install_github("ironholds/geohash") #install.packages("geohash")
  library(geohash)
}

if(!require(rgeos)){
  install.packages("rgeos")
  library(rgeos)
}

if(!require(geohasTools)){
  devtools::install_github("MichaelChirico/geohashTools")
  library(geohashTools)
}

if(!require(geosphere)){
  install.packages("geosphere")
  library(geosphere)
}
if(!require(sp)){
  install.packages("sp")
  library(sp)
}
if(!require(ggplot2)){
  install.packages("ggplot2")
  library(ggplot2)
}
Step 2 - Data Import
Import the dataset. na.strings includes “NA”, “NULL”, “” and “ “. stringsAsFactors = FALSE Sofia topography
SofiaTopography <- read.csv("/data/sofia_topo.csv", header = TRUE,na.strings = c(""," ","NA","#NA","#NULL","NULL"),stringsAsFactors = FALSE)
sapply(SofiaTopography,class)
Citizen data
Data2017 <- read.csv("/data/data_bg_2017.csv",header = TRUE,na.strings = c(""," ","NA","#NA","#NULL","NULL"),stringsAsFactors = FALSE)
Data2018 <- read.csv("/data/data_bg_2018.csv",header = TRUE,na.strings = c(""," ","NA","#NA","#NULL","NULL"),stringsAsFactors = FALSE)
Step 3 - Deal with citizen data and topography data
Transofrm time in Data2017 and Data2018 into POSIXct and check the classes again
sapply(Data2017,class)
sapply(Data2018,class)
Data2017 <- mutate(Data2017,time = ymd_hms(time))
Data2018 <- mutate(Data2018,time = ymd_hms(time))
sapply(Data2017,class)
sapply(Data2018,class)
Merge the two datasets
DataAll <- bind_rows(Data2017,Data2018)
sapply(DataAll,class)
NAsbyCol <- as.data.frame(sapply(DataAll, function(x) length(which(is.na(x)))))
DataAll <- DataAll[is.na(DataAll$geohash) == 0,]
Decode the geohashes
decodedHashes <- gh_decode(DataAll$geohash)
Merge with the data
DataAll <- bind_cols(DataAll,decodedHashes[,c("lat","lng")])
Using the function point.is.polygon we create a vector which shows if the coordiantes are in the poligon defined by the Sofia Topography map
Get coordinates of the stations
xOfStations = as.vector(decodedHashes$lng)
yOfStations = as.vector(decodedHashes$lat)
Get coordinates of Sofia
xOfSofia <- as.vector(SofiaTopography$Lon)
yOfSofia <- as.vector(SofiaTopography$Lat)
Create the vector
isStationInSofia <- as.vector(point.in.polygon(xOfStations, yOfStations, xOfSofia, yOfSofia))
rm(xOfStations,yOfStations,xOfSofia,yOfSofia,decodedHashes,SofiaTopography,Data2017,Data2018,NAsbyCol)
gc()
Sofia data
DataAllSofia <- DataAll[which(isStationInSofia == 1),]
#Look at and take care of duplicates
Duplicates <- DataAllSofia %>%
  group_by(geohash,time) %>%
  summarise(countObs = n()) %>%
  dplyr::filter(countObs > 1)

LookAtDuplicates <- left_join(Duplicates,DataAllSofia,by = c("geohash", "time")) %>%
  arrange(geohash,time)

DataAllSofia <- DataAllSofia %>%
  group_by(geohash,time) %>%
  summarise(P1 = mean(P1),lat = mean(lat), lng = mean(lng))
rm(Duplicates,LookAtDuplicates,DataAll,isStationInSofia)
gc()
Remove observations with a lot of p1 observations equal to 0
CheckP1Zeroes <- DataAllSofia %>%
  group_by(geohash) %>%
  summarise(obs = n(), P1Zeroes = sum(ifelse(P1 == 0,1,0)), PercP1Zeroes = P1Zeroes / obs) %>%
  arrange(PercP1Zeroes)
notProperMeasurments <- CheckP1Zeroes[CheckP1Zeroes$PercP1Zeroes > thresholdForRemovalMissingP1,"geohash"]
DataAllSofia <- DataAllSofia[!(DataAllSofia$geohash %in% notProperMeasurments$geohash),]
rm(CheckP1Zeroes,notProperMeasurments)
gc()
Remove outliers for P1
EEAHourly <- do.call(bind_rows,teu)
EEADataMaxByHour <- EEAHourly %>%
  group_by(time) %>%
  summarise(maxP1 = max(P1), minP1 = min(P1))

DataAllSofia <- left_join(DataAllSofia,EEADataMaxByHour, by = c("time" = "time"))
Keep only citizen data in the timeframe
DataAllSofia = DataAllSofia[DataAllSofia$time >= min(EEAHourly$time),]
DataAllSofia = DataAllSofia[DataAllSofia$time <= max(EEAHourly$time),]
rm(EEADataMaxByHour,teu,EEAHourly)
gc()
DeviationThreshold <- data.frame(
                        Threshold=double(),
                        CappedP1Count=integer(),
                        CappedP1Percent=double()
                        )
for (i in seq(from = 1, to = 2, by = 0.05)){
  helpTable <- DataAllSofia %>%
    mutate(CappedP1 = ifelse(P1 >= i * maxP1, 1,0 ))
  DeviationThreshold <- rbind(DeviationThreshold,c(i,sum(helpTable$CappedP1),sum(helpTable$CappedP1) / nrow(helpTable)))
}
names(DeviationThreshold) <- c("Threshold","CappedP1Count","CappedP1Percent")

ggplot() +  geom_bar(data=DeviationThreshold, aes(x = Threshold, y = CappedP1Count) , stat ="identity")

ggplot() +  geom_bar(data=DeviationThreshold, aes(x = Threshold, y = CappedP1Percent) , stat ="identity")

thresholdP1ForDeviationFromOfficial <- 1.25
Caps the P1 of the citizen data at thresholdP1ForDeviationFromOfficial% of official P1 maximum
DataAllSofia <- DataAllSofia %>%
  mutate(P1 = ifelse(P1 >= thresholdP1ForDeviationFromOfficial * maxP1,thresholdP1ForDeviationFromOfficial * maxP1,P1))
Remove obs with less than 90 days
GroupedDataSofiaGeohash <- DataAllSofia %>%
  group_by(geohash) %>%
  summarise(obs = n(), tmin = min(time), tmax = max(time), days = as.numeric(tmax - tmin), lat = mean(lat), lng = mean(lng)) %>%
  arrange(days,geohash)

DaysOfObservationsThreshold <- data.frame(
  Threshold=double(),
  DaysCount=integer(),
  DaysPercent=double()
)

for (i in seq(from = 1, to = 180, by = 1)){
  helpTable <- GroupedDataSofiaGeohash[GroupedDataSofiaGeohash$days <= i,c("geohash","lng","lat","days")]

  DaysOfObservationsThreshold <- rbind(DaysOfObservationsThreshold,c(i,nrow(helpTable),nrow(helpTable) / nrow(GroupedDataSofiaGeohash)))
}
names(DaysOfObservationsThreshold) <- c("Threshold","DaysCount","DaysPercent")

ggplot() +  geom_bar(data=DaysOfObservationsThreshold, aes(x = Threshold, y = DaysCount) , stat ="identity")

ggplot() +  geom_bar(data=DaysOfObservationsThreshold, aes(x = Threshold, y = DaysPercent) , stat ="identity")

thresholdForMinimumObservationDays = 90
removeWithoutEnoughObservations <- GroupedDataSofiaGeohash[GroupedDataSofiaGeohash$days <= thresholdForMinimumObservationDays,c("geohash","lng","lat")]

DataAllSofia <- DataAllSofia[!(DataAllSofia$geohash %in% removeWithoutEnoughObservations$geohash),]
rm(removeWithoutEnoughObservations)

GroupedDataSofiaGeohash <- DataAllSofia %>%
  group_by(geohash) %>%
  summarise(obs = n(), tmin = min(time), tmax = max(time), days = as.numeric(tmax - tmin), lat = mean(lat), lng = mean(lng)) %>%
  arrange(days,geohash)

citizenGeohash <- GroupedDataSofiaGeohash$geohash
DistanceBetweenCitizenStations <- as.data.frame(gDistance(SpatialPoints(GroupedDataSofiaGeohash[,c("lng","lat")]), byid=TRUE))
ListOfCloseness <- apply(DistanceBetweenCitizenStations,1,function (x) which(x < thresholdForCloseness))
names(ListOfCloseness) <- citizenGeohash

AbsDiffBetweenCitizens <- vector("list", length(citizenGeohash))
names(AbsDiffBetweenCitizens) <- citizenGeohash
AbsDiffBetweenStationsCount <- vector("list", length(citizenGeohash))
names(AbsDiffBetweenStationsCount) <- citizenGeohash

InnerJoins <- vector("list", length(citizenGeohash))
names(InnerJoins) <- citizenGeohash

AbsDiffBetweenCitizensDataframe <- data.frame(matrix(NA,length(citizenGeohash),length(citizenGeohash)))
names(AbsDiffBetweenCitizensDataframe) <- seq(1:length(citizenGeohash))
row.names(AbsDiffBetweenCitizensDataframe) <- seq(1:length(citizenGeohash))
AbsDiffBetweenCitizensCountDataframe <- data.frame(matrix(NA,length(citizenGeohash),length(citizenGeohash)))
names(AbsDiffBetweenCitizensCountDataframe) <- seq(1:length(citizenGeohash))
row.names(AbsDiffBetweenCitizensCountDataframe) <- seq(1:length(citizenGeohash))

thresholdForCloseness <- 0.01
Determines which stations are considered close enough to comapre the P1 measurments
thresholdForCommonObservations <- 168
Number of common observations to considered a difference in measurments in P1
thresholdForAbsoluteDifference <- 10
Threshold above which citizen measurments are considered too different
thresholdForAbsoluteDifferencePercentage <- 0.25
thresholdForDifference <- 0.05
thresholdForDifferentStations <- 1
Threshold showing how many close stations can have different measurments before exclusion
for (i in 1:length(citizenGeohash)){
  InnerJoins[[i]] <- vector("list", length(ListOfCloseness[[i]]))
  z = 0
  AbsDiffBetweenCitizens[[i]] <- data.frame(matrix(NA,1,1))
  names(AbsDiffBetweenCitizens[[i]]) <- "empty"
  row.names(AbsDiffBetweenCitizens[[i]]) <- i
  AbsDiffBetweenStationsCount[[i]] <- data.frame(matrix(NA,1,1))
  names(AbsDiffBetweenStationsCount[[i]]) <- "empty"
  row.names(AbsDiffBetweenStationsCount[[i]]) <- i
  geo1 <- GroupedDataSofiaGeohash[i,"geohash"]
  for (j in c(ListOfCloseness[[i]])){
    z = z + 1
    geo2 <- GroupedDataSofiaGeohash[j,"geohash"]
    a <- DataAllSofia[DataAllSofia$geohash == geo1$geohash,c("time","P1")]
    b <- DataAllSofia[DataAllSofia$geohash == geo2$geohash,c("time","P1")]
    comb <- inner_join(a,b, by = c("time"))
    InnerJoins[[i]][[z]] <- comb
    if (dim(comb)[1] == 0){
      combDiff <- as.data.frame(NA)
      names(combDiff) <- j
      bleh <- as.data.frame(NA)
      names(bleh) <- j
      AbsDiffBetweenCitizens[[i]] <- bind_cols(AbsDiffBetweenCitizens[[i]],combDiff)
      AbsDiffBetweenStationsCount[[i]] <- bind_cols(AbsDiffBetweenStationsCount[[i]],bleh)
    }
    else{
      AbsDiffBetweenCitizensDataframe[i,j] <- ifelse(nrow(comb) <= thresholdForCommonObservations,NA,sum(if_else(abs(comb[,2] - comb[,3]) >= thresholdForAbsoluteDifference & abs(comb[,2] - comb[,3]) / max(comb[,2],comb[,3]) >= thresholdForAbsoluteDifferencePercentage,1,0),na.rm = TRUE) / nrow(comb))
      AbsDiffBetweenCitizensCountDataframe[i,j] <- nrow(comb)
      combDiff <- as.data.frame(ifelse(nrow(comb) <= thresholdForCommonObservations,NA,sum(if_else(abs(comb[,2] - comb[,3]) >= thresholdForAbsoluteDifference & abs(comb[,2] - comb[,3]) / max(comb[,2],comb[,3]) >= thresholdForAbsoluteDifferencePercentage,1,0),na.rm = TRUE) / nrow(comb)))
      names(combDiff) <- j
      bleh <- as.data.frame(nrow(comb))
      names(bleh) <- j
      AbsDiffBetweenCitizens[[i]] <- bind_cols(AbsDiffBetweenCitizens[[i]],combDiff)
      AbsDiffBetweenStationsCount[[i]] <- bind_cols(AbsDiffBetweenStationsCount[[i]],bleh)
    }
  }
}

ListOfDifferencesNew <- apply(AbsDiffBetweenCitizensDataframe,1,function (x) length(which(x > thresholdForDifference)))
x <- max(ListOfDifferencesNew)
y <- which(ListOfDifferencesNew == x)
citizenGeohashNew <- citizenGeohash
DistanceBetweenCitizenStationsNew <- DistanceBetweenCitizenStations

while(x > thresholdForDifferentStations){
  citizenGeohashNew <- citizenGeohashNew[-y]
  DistanceBetweenCitizenStationsNew <- DistanceBetweenCitizenStationsNew[-y,-y]
  ListOfClosenessNew <- apply(DistanceBetweenCitizenStationsNew,1,function (x) which(x <= thresholdForCloseness))
  names(ListOfClosenessNew) <- citizenGeohashNew

  AbsDiffBetweenCitizensNew <- vector("list", length(citizenGeohashNew))
  names(AbsDiffBetweenCitizensNew) <- citizenGeohashNew
  AbsDiffBetweenStationsCountNew <- vector("list", length(citizenGeohashNew))
  names(AbsDiffBetweenStationsCountNew) <- citizenGeohashNew

  InnerJoinsNew <- vector("list", length(citizenGeohashNew))
  names(InnerJoinsNew) <- citizenGeohashNew

  AbsDiffBetweenCitizensDataframeNew <- data.frame(matrix(NA,length(citizenGeohashNew),length(citizenGeohashNew)))
  names(AbsDiffBetweenCitizensDataframeNew) <- seq(1:length(citizenGeohashNew))
  row.names(AbsDiffBetweenCitizensDataframeNew) <- seq(1:length(citizenGeohashNew))
  AbsDiffBetweenCitizensCountDataframeNew <- data.frame(matrix(NA,length(citizenGeohashNew),length(citizenGeohashNew)))
  names(AbsDiffBetweenCitizensCountDataframeNew) <- seq(1:length(citizenGeohashNew))
  row.names(AbsDiffBetweenCitizensCountDataframeNew) <- seq(1:length(citizenGeohashNew))

  for (i in 1:length(citizenGeohashNew)){
    InnerJoinsNew[[i]] <- vector("list", length(ListOfClosenessNew[[i]]))
    z = 0
    AbsDiffBetweenCitizensNew[[i]] <- data.frame(matrix(NA,1,1))
    names(AbsDiffBetweenCitizensNew[[i]]) <- "empty"
    row.names(AbsDiffBetweenCitizensNew[[i]]) <- i
    AbsDiffBetweenStationsCountNew[[i]] <- data.frame(matrix(NA,1,1))
    names(AbsDiffBetweenStationsCountNew[[i]]) <- "empty"
    row.names(AbsDiffBetweenStationsCountNew[[i]]) <- i
    geo1 <- GroupedDataSofiaGeohash[i,"geohash"]
    for (j in c(ListOfClosenessNew[[i]])){
      z = z + 1
      geo2 <- GroupedDataSofiaGeohash[j,"geohash"]
      a <- DataAllSofia[DataAllSofia$geohash == geo1$geohash,c("time","P1")]
      b <- DataAllSofia[DataAllSofia$geohash == geo2$geohash,c("time","P1")]
      comb <- inner_join(a,b, by = c("time"))
      InnerJoinsNew[[i]][[z]] <- comb
      if (dim(comb)[1] == 0){
        combDiff <- as.data.frame(NA)
        names(combDiff) <- j
        bleh <- as.data.frame(NA)
        names(bleh) <- j
        AbsDiffBetweenCitizensNew[[i]] <- bind_cols(AbsDiffBetweenCitizensNew[[i]],combDiff)
        AbsDiffBetweenStationsCountNew[[i]] <- bind_cols(AbsDiffBetweenStationsCountNew[[i]],bleh)
      }
      else{
        AbsDiffBetweenCitizensDataframeNew[i,j] <- ifelse(nrow(comb) <= thresholdForCommonObservations,NA,sum(if_else(abs(comb[,2] - comb[,3]) >= thresholdForAbsoluteDifference & abs(comb[,2] - comb[,3]) / max(comb[,2],comb[,3]) >= thresholdForAbsoluteDifferencePercentage,1,0),na.rm = TRUE) / nrow(comb))
        AbsDiffBetweenCitizensCountDataframeNew[i,j] <- nrow(comb)
        combDiff <- as.data.frame(ifelse(nrow(comb) <= thresholdForCommonObservations,NA,sum(if_else(abs(comb[,2] - comb[,3]) >= thresholdForAbsoluteDifference & abs(comb[,2] - comb[,3]) / max(comb[,2],comb[,3]) >= thresholdForAbsoluteDifferencePercentage,1,0),na.rm = TRUE) / nrow(comb)))
        names(combDiff) <- j
        bleh <- as.data.frame(nrow(comb))
        names(bleh) <- j
        AbsDiffBetweenCitizensNew[[i]] <- bind_cols(AbsDiffBetweenCitizensNew[[i]],combDiff)
        AbsDiffBetweenStationsCountNew[[i]] <- bind_cols(AbsDiffBetweenStationsCountNew[[i]],bleh)
      }
    }
  }
  ListOfDifferencesNew <- apply(AbsDiffBetweenCitizensDataframeNew,1,function (x) length(which(x > thresholdForDifference)))
  x <- max(ListOfDifferencesNew)
  y <- which(ListOfDifferencesNew == x)
}

DataAllSofiaFiltered <- DataAllSofia[DataAllSofia$geohash %in% citizenGeohashNew,]

citizen <- vector("list", length(citizenGeohashNew))
names(citizen) <- citizenGeohashNew
for (i in citizenGeohashNew){
  citizen[[i]] = DataAllSofiaFiltered[DataAllSofiaFiltered$geohash == i,]
  citizen[[i]]=as.data.frame(seq.POSIXt(from=min(citizen[[i]]$time),to=max(citizen[[i]]$time), by="hour"))
  colnames(citizen[[i]])[1]="time"
  citizen[[i]]$date=date(citizen[[i]]$time)
  citizen[[i]]=left_join(citizen[[i]],DataAllSofiaFiltered[DataAllSofiaFiltered$geohash == i,c("time","geohash","P1")],by="time")
  citizen[[i]]$geohash = i
  citizen[[i]]$lng = as.numeric(unique(DataAllSofiaFiltered[DataAllSofiaFiltered$geohash == i,"lng"]))
  citizen[[i]]$lat = as.numeric(unique(DataAllSofiaFiltered[DataAllSofiaFiltered$geohash == i,"lat"]))
  citizen[[i]][,"P1"]=na.interpolation(citizen[[i]][,"P1"], option="linear")
  citizen[[i]]$date <- as.Date(citizen[[i]]$date)
}

citizenDaily <- vector("list", length(citizenGeohashNew))
names(citizenDaily) <- citizenGeohashNew

for (i in citizenGeohashNew){
  citizenDaily[[i]] <- citizen[[i]] %>%
    group_by(date) %>%
  summarise(geohash = unique(geohash),P1=mean(P1),lng=mean(lng),lat=mean(lat))
  citizenDaily[[i]]$date <- as.Date(citizenDaily[[i]]$date)
}

AllCitizenDaily <- do.call(bind_rows,citizenDaily)

AllCitizenDaily <- AllCitizenDaily %>%
  group_by(date) %>%
  summarise(count = n())%>%
  dplyr::arrange(date)

ggplot() +  geom_bar(data=AllCitizenDaily, aes(x = date, y = count) , stat ="identity")
[Acknowledgment] [Introduction] [Methodology] [Bias correction] [Analysis] [Features] [Prediction] [Summary]