Methodology
The problem of predicting the air pollution in urban areas has been of central research interest in recent years. As suggested by (Kolehmainen, et al., 2001) and later by (Russo, et al., 2015) forecasting air pollution concentrations in urban locations emerges as a priority for guaranteeing life and environmental quality. Consequently, numerous papers are aimed to construct predictive models of daily air pollution as measured by the concentrations of PM10 and other air pollutants such as SO2, NO2, CO, etc. Nevertheless, the issue with PM10 concentration is of special importance as its yearly and 24-hour levels are subject to restrictions defined by the new European Air Quality Directive (EC/2008/50). As highlighted by (Siwek & Osowski, 2016) in order to comply with the short term limits defined in the directive and diminish dangerous concentration levels, actions should be planned at least one day in advance.
This paper also contributes to the topic. We develop a general framework for analysis and prediction of air pollution in the city of Sofia, Bulgaria, as measured by the level of the PM10 air pollutant indicator. As a starting point in our analysis we consider earlier findings documented in the literature therefore the following text provides a brief review of selected papers. We focus on utilized methodology so as to support the process of defining proper predictive approach that is adopted in our methodological framework.
Literature Review
(Russo, et al., 2015) study daily PM10 concentrations in the metropolitan region of Lisbon, Portugal as measured by twelve monitoring stations. The authors adapt neural networks approach. They use as predictors lagged values (the lag is of one day) of daily mean concentrations of various air pollutants as well as maximum concentration of PM10. Also, information on daily circulation weather type at three boundary layers heights is considered as well as other weather metrics such as temperature, wind direction and intensity, humidity and radiance. (Catalano, et al., 2016) study hourly mean concentration of NO2 for Marylebone road in the City of London based on past observations on the concentration of NO2 as well as traffic and weather conditions. The research applies an artificial neural network approach (ANN) and the ARIMAX model. Among others, the authors illustrate the benefits of the synergic use of both of the approaches for improving the forecast accuracy. (Feng, et al., 2015) study the level of air pollution in two areas located in northeast China characterized by rapid increase of urbanization as measured by the air pollutant PM2.5. Their methodology builds on ANN approach. In particular, the authors apply air mass trajectory model to recognize distinct corridors for transport of dirty and clean air to the studied stations, where wind speed and direction are considered as parameters of the trajectory. Furthermore, the original sequence of observations on PM2.5 is decomposed into series with lower variability via application of the wavelet transform. The latter improves significantly the prediction accuracy.
(Cortina-Januchs, et al., 2015) build predictive model for the next 24-hours average air pollution concentration as measured by the level of PM10 and SO2in Salamanca, Mexico. The latter has been ranked as one of the most polluted cities in Mexico. The database of features consists of historic time series of meteorological variables and concentrations of PM10 for three measurement stations. The proposed model is a combination of multilayer perception neural network and clustering algorithm. Evaluation of performance is achieved on the basis of RMSE (root mean squared error) and MAE (mean absolute error) against simpler alternatives. (Kurt, et al., 2008) develop an online air pollution forecasting system based on neural network approach. The authors use weather condition, day and night temperature, humidity, pressure, and wind speed and direction , as well as day of the week as exogenous features. Documented results evidence that quite accurate predictions are achieved even with a simple neural network.
As suggested by the reviewed papers meteorological variables play an important role in the process of predicting the concentration of air pollutants in the air. Yet, their values are not available at the time when the next day forecast is generated thus their predicted values are used instead. (Huebnerova & Michalek, 2014) study the performance of prediction models on the concentration of PM10 when the predicted covariates are used instead of the observed ones for Brno, Czech Republic. They come to the finding that there is no significant effect for the case under study and predicted meteorological variables can be employed in the environmental management process. Last but not least, the paper of (Siwek & Osowski, 2016) highlights the importance of feature engineering in the process of building accurate air prediction models.
Definition of Methodology Framework
We use the following summary of findings documented in the reviewed literature as basis to define our methodology framework.
- Lagged values of PM10 concentration levels as well as meteorological indicators are used as common features in the process of building air pollution predictive models.
- Authors such as (Siwek & Osowski, 2016), (Kurt, et al., 2008), (Feng, et al., 2015) suggest that feature engineering improves performance of these models.
- Most of the authors adopt nonlinear models based on neural networks.
- Combination of nonlinear modelling and ARIMAX is beneficial.
- RMSE and MAE are used as common performance measure against simpler (naïve) forecasts.
We should note that the reviewed papers are focused solely on the predictive modelling of air pollution measured at several official stations. Therefore, our core modelling process is performed using PM10 air pollution measurements at five official stations in Sofia. At the same time we integrate this model to PM10 air pollution measurements for a wide coverage of observation points spread over the entire city through utilization of citizens' science stations data. We consider the latter as an important contribution of this research.
However, even widely available, citizens' science stations datasets require bias correction so as to become usable for research and information purposes. Therefore, the first module (Module 1 at Figure 7) of our methodology performs citizens' science stations data preprocessing and cleaning. We develop a robust procedure that groups citizen science stations located in a close proximity into one geo-unit. Measurements on PM10 concentration within each geo-unit are compared and if any differences behind a pre-specified threshold are identified, cleaning is introduced. Furthermore, we benchmark concentration levels at geo-units with those measured at the official stations and bias correction is introduced where necessary.Module 1 automates fully the process of data preparation and data cleaning. Its output is cleaned dataset by geo-units.
The second module in our methodology framework (Module 2 at Figure 7) performs the core prediction modelling. We use data on PM10 air pollution measurements at five official stations in Sofia published by EEA and meteorological data as published by Sofia Airport Weather Station. An important step in our analysis is the process of feature engineering. Following the findings in the literature, we adopt nonlinear approach. Yet, while the majority of papers apply neural networks, we decide to model the observed nonlinearities via the random forest approach. On one hand, our preliminary data analysis indicates that tree-based methods are particularly well-suited to dependencies observed in the analyzed dataset. Thus, we derive prediction accuracy comparable to results reported in similar studies, e.g. (Kurt, et al., 2008). At the same time, unlike neural network, the random forest approach preserves interpretability of results and enables analysis of variables importance.The output of Module 2 is prediction model for next-day PM10 concentration at the official stations. It is based on observed meteorological data. Yet, as suggested in (Huebnerova & Michalek, 2014), predictions delivered using forecasted weather indicators is not expected influence significantly the prediction accuracy reported in Section 4 of this text.
The third module of our methodology (Module 3 at Figure 7) integrates results of Module 1 and Module 2. It builds predictive models by geo-units. The module applies ARIMAX modelling, where the matrix of exogenous features X is defined as follows:

 denotes the PM10 concentration measurement at official station i, where i = 1,…, 5 and
  is the features matrix generated by Module 2. Prior to fitting ARIMAX parameters we apply LASSO (Least absolute shrinkage and selection operator) so as to perform feature selection. We should note that this approach incorporates additional corrective modelling for the cleaned citizen network data through introduction of
  in the ARIMAX model specification, where \(i\) is selected via the adopted LASSO approach. The output of Module 3 is prediction model for next-day PM10 concentration at geo-units. Predictions could be delivered by using the prediction output of Module 2.
Note: Technically speaking, if after cleaning data on PM10 concentrations by geo-units still some mismeasurements are left, they should be absorbed in the vector of residuals the estimated ARIMA equation.
The overall framework of our methodology is summarized at Figure 7.
The code for each module is programmed in R and it is part of this paper.
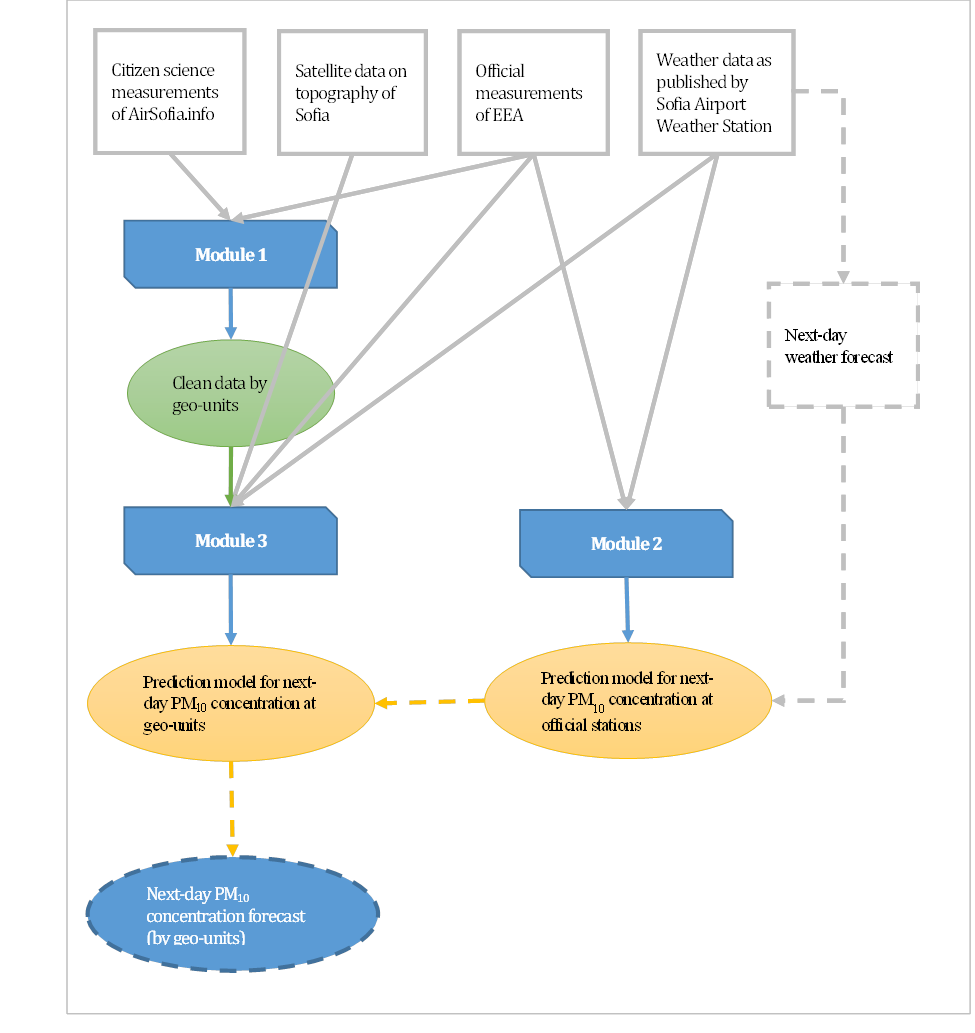
Figure 7: Methodology framework. Source: Own
References
Catalano, M. et al., 2016. Improving the prediction of air pollution peak episodes generated by urban transport network. Environmental Science & Plicy, Volume 60, pp. 69-83.
Cortina-Januchs, M., Quintanilla-Dominguez, J., Vega-Corona, A. & Andina, D., 2015. Development of a model for forecasting of PM10 concentrations in Salamanca, Mexico. Atmospheric Pollution Research, Volume 6, pp. 626-34.
Feng, X. et al., 2015. Artificial neural networks forecasting of PM2.5 pollution using air mass trajectory based geographic model and wavelet transformation. Atmospheric Environment, Volume 107, pp. 118-28.
Huebnerova, Z. & Michalek, J., 2014. Analysis of daily average PM10 predictions by generalized linear models in Brno, Czech Republic. Atmospheric Pollution Research, Volume 5, pp. 471-76.
Kolehmainen, M., Martikainen, H. & Ruuskanen, J., 2001. Neural networks and periodic components used in air quality forecasting. Atmospheric Environment, Volume 35, pp. 815-25.
Kurt, A., Gulbagci, B., Karaca, F. & Alagha, O., 2008. An online air pollution forecasting system using neural networks. Environment International, Volume 34, pp. 592-98.
Russo, A. et al., 2015. Neural network forecast of daily pollution concentraion using optimal meteorological data at synoptic and local scales. Atmospheric Pollution Research, Volume 6, pp. 540-49.
Siwek, K. & Osowski, S., 2016. Data mining methods for prediction of air pollution. Intrenational Journal of Applied Mathematics and Computer Science, 26(2), pp. 467-78.
[Acknowledgment] [Introduction] [Methodology] [Bias correction] [Analysis] [Features] [Prediction] [Summary]